The base grafana chart is pretty easy to ship out and the Oauth login feature is incredibly handy. You can easily use your Github or Gitlab organization to manage access to Grafana and offload the authentication process. If your Github or Gitlab is managed by SSO, you inherit this SSO for free with Grafana. Let’s take a look how.
We’re going to use Gitlab as an example here. First, let’s create an Oauth application by going to https://gitlab.com/profile/applications
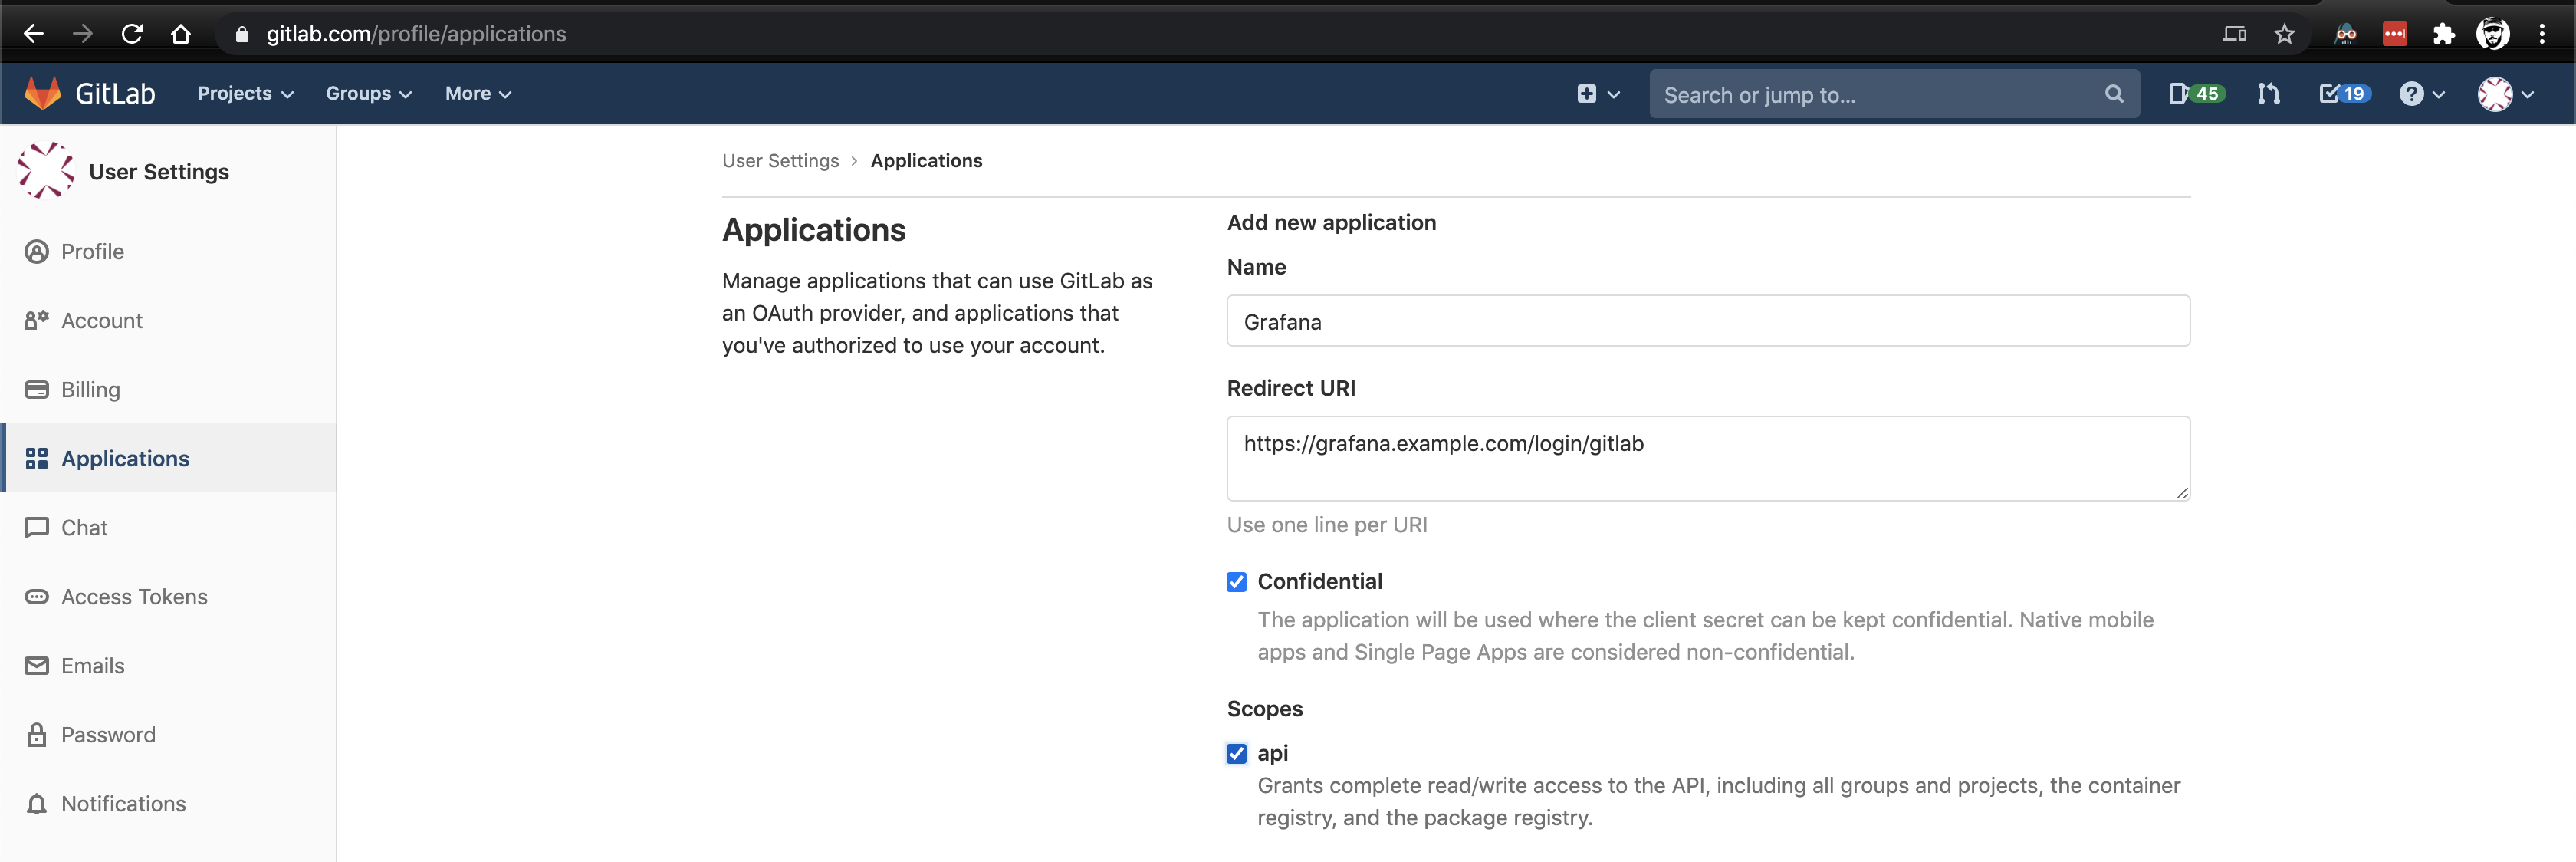
Give it a name and select the API scope. The redirect URL should be the base address of your Grafana server with a route of /login/gitlab. For example: https://grafana.example.com/login/gitlab.
Once created, you get an Application ID and a Secret. Keep that page handy because you’ll need it shortly.
Over on the Flux/Helm/whatever side, deploy the Helm chart. We’re using flux, but the principle is the same. Note the values file.
Here are some things to pay attention to:
- If you are using Oauth and behind a proxy (this means you if you’re on Kubernetes) you have to set the
root_url allow_sign_upshould be true if you want to allow people to log into Grafana by virtue of their Gitlab group membership without adding them in Grafana first (you probably want this if you’re reading this post).- The
client_idandclient_secretaren’t encrypted and at present they cannot be provided as secrets using this chart. I’m going to look into writing a patch to allow this, hopefully. - The data sources section is setup to look for prometheus and loki, which will be discussed in upcoming posts
---
apiVersion: helm.fluxcd.io/v1
kind: HelmRelease
metadata:
  name: grafana
  namespace: monitoring  # I can only run it in default for some reason
spec:
  releaseName: grafana
  targetNamespace: monitoring
  timeout: 300
  resetValues: false
  wait: false
  forceUpgrade: false
  chart:
    repository: https://kubernetes-charts.storage.googleapis.com
    name: grafana
    version: 5.3.6
  values:
    grafana.ini:
      server:
        domain: grafana.example.com
        root_url: https://grafana.example.com/
      auth.gitlab:
        enabled: true
        allow_sign_up: true
        client_id: aaaabbbbcccc
        client_secret: ddddeeeeffff
        scopes: api
        auth_url: https://gitlab.com/oauth/authorize
        token_url: https://gitlab.com/oauth/token
        api_url: https://gitlab.com/api/v4
        allowed_groups: your-gitlab-group, another-gitlab-group
    ingress:
      enabled: true
      annotations:
        kubernetes.io/ingress.class: "nginx"
        cert-manager.io/cluster-issuer: "letsencrypt-prod"
        cert-manager.io/acme-challenge-type: http01
      hosts:
      - grafana.example.com
      path: /
      tls:
      - hosts:
        - grafana.example.com
        secretName: grafana-tls
    persistence:
      enabled: true
      size: 1Gi
      storageClassName: "do-block-storage"
    initChownData:
      enabled: false
    adminUser: your-admin-user
    datasources:
      datasources.yaml:
        apiVersion: 1
        datasources:
          - name: Prometheus
            type: prometheus
            url: http://prometheus-server
            access: proxy
            isDefault: true
          - name: Loki
            type: loki
            url: http://loki:3100
            access: proxy
            isDefault: false
Now, let’s take a look at our Grafana instance to see our pretty login button

When trying to log in via Gitlab, if you get an error like “The redirect URI included is not valid” then the most likely problem is that the root_url is not set properly and Grafana is defaulting to localhost:3000 as the redirect URI after authentication. You can check this by opening the developer console (ctrl+shift+c in Chrome, cmd+shift+c on macOS), going to the network tab, and then clicking the login button to observe the calls. If you see localhost in the URL parameters, your grafana.ini does not have a base_url set and is redirecting to the wrong place.
Hopefully by this point you’ve got everything setup and you’re logging into your Grafana instance with Github or Gitlab (or both!). In future posts, we’ll talk about deploying Prometheus and Loki, settig up dashboards, and setting up alerts.